|
|
2 years ago | |
|---|---|---|
| .ipynb_checkpoints | 2 years ago | |
| Environmental.py | 2 years ago | |
| Graph.png | 2 years ago | |
| Humidity[%] vs PV's Power[W].png | 2 years ago | |
| Luxes[lx] vs PV's Power[W].png | 2 years ago | |
| Pearson.jpeg | 2 years ago | |
| README.md | 2 years ago | |
| Spearman.jpeg | 2 years ago | |
| data_plot.csv | 2 years ago | |
| med.csv | 2 years ago | |
| med_discri.csv | 2 years ago | |
README.md
Description
This public repository contains datasets, preprocessing scripts, and supplementary materials associated with the article titled "Predictive Modeling of Photovoltaic Panel Power Production through On-Site Environmental and Electrical Measurements Using Artificial Neural Networks." The datasets provide insights into the performance of PV panels under various conditions and are crucial for the development of predictive models.
This readme.md file provides step-by-step guidance on how to use the provided data and scripts. Researchers and developers can use this data to replicate the study, develop their predictive models, or conduct further analyses.
Contents
-
Raw Data Files:
med.csv: Power production data of the PV panel over 15 days that includes lighting, temperature, and humidity environmental measurements logged every 5 minutes.
-
Preprocessed Data:
med_discri.csv: Power production data of the PV panel over 15 days without night measurements that includes lighting, temperature, and humidity environmental measurements logged every 5 minutes.data_plots.csv: Data of 1000 instances for plotting, correlation, and modeling process; instances used in the published paper.
-
Scripts and Notebooks:
- Will be included soon.
Files structure
The structure of each csv file is similar and is shown below:
luxes, temp, hum, curr, volt, power, dd,hh,mm
3133.44,18,79,0.07,14.69,1.09,28,15,17
5765.12,18,76,0.14,14.73,1.98,28,15,12
5575.68,18,77,0.13,14.73,1.93,28,15,7
5506.56,18,77,0.13,14.72,1.93,28,15,2
5931.52,19,74,0.14,14.73,2.01,28,14,57
5565.44,18,75,0.13,14.72,1.92,28,14,52
6051.84,18,80,0.14,14.73,2.11,28,14,47
3304.96,17,78,0.08,14.69,1.18,28,14,42
2769.92,18,77,0.07,14.69,0.99,28,14,37
5309.44,19,76,0.12,14.73,1.82,28,14,32
8555.52,19,75,0.2,14.77,2.97,28,14,27
The columns are arranged as follows:
luxes: lighting measurements in luxes [lx] obtained in the same PV's angle.temp: temperature measurements in degrees Celsius [C] at the PV's structure.hum: relative humidity in [%RH] at the PV's structure.curre: current measurements in Amperes [A] measured at the PV's electrical output.volt: voltage measurements in volts [V] measured at the PV's electrical output.- power: computed electrical power in Watts [S] obtained by multiplying the voltage and current measured.
dd: two-digit format for day-of-month identification.hh: two-digit format for hour of day identification.mm: two-digit format for minutes of day identification.
More detail about the collected data can be consulted in the published paper.
Citation: Users of this dataset are required to cite the associated article and provide appropriate acknowledgment. included info soon
Environmental.py
The code of this file is divide in follow sections
- Filtering data Function
Takes all data from the raw data file (
med.csv), between b and e. It returns the filtered data for lux, temperature, humidity and power. - Correlation Function
Uses the scipy library to calculate Pearson and Spearman correlations, employing two nested
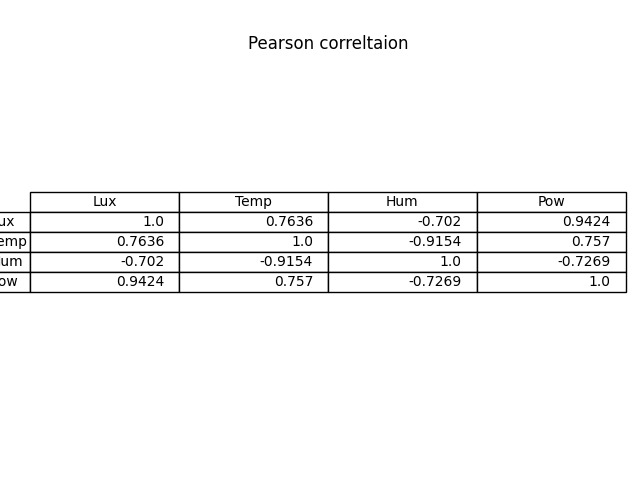
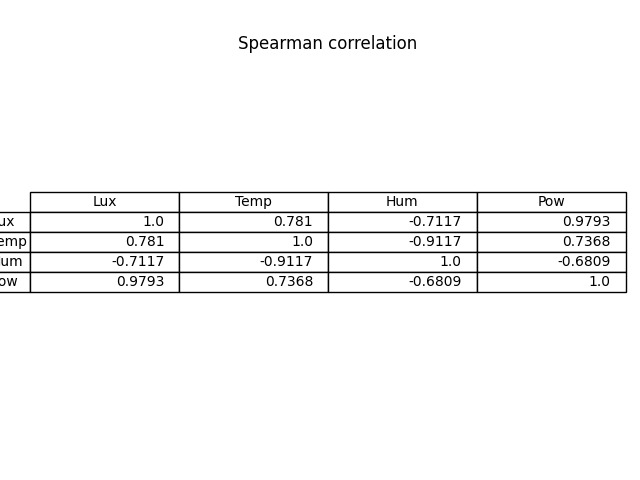
forloops that populate an empty 4x4 matrix with correlation values. This function takes four inputs; the first four values represent data, and the last indicates which correlation to calculate—pfor Pearson correlation andsfor Spearman correlation. Correlations for med data base are shhown below:
-
Plotting data function Takes values from lux, temperature, humidity and power, and builds a figure of size 4x4. The structure of these graphs is shown below:
Lux [Lux vs Temp] [Lux vs Hum ] [Lux vs Pow ] [Temp vs Lux] Temp [Temp vs Hum] [Temp vs Pow] [Hum vs Lux ] [Hum vs Temp] Hum [Hum vs Pow ] [Pow vs Lux ] [Pow vs Temp] [Pow vs Hum ] Pow -
Plotting Temperature Bar Function Generates a scatter plot with temperature bars. The input data includes coordinates for the x and y axes, limits for the x and y axes, titles for the x and y axes, and the temperature associated with each point.
-
Plotting data First, the information from all databases is divided into lux, temperature, humidity, and power. Then, the
GenGraphfunction, defined in the Plotting data function section, and theGenGraphTempfunction, defined in the Plotting Temperature Bar Function section, are used.


