You cannot select more than 25 topics
Topics must start with a letter or number, can include dashes ('-') and can be up to 35 characters long.
|
|
5 months ago | |
|---|---|---|
| .. | ||
| 1a_1_5x_D.png | 5 months ago | |
| 1a_2_5x_D.png | 5 months ago | |
| 1a_3_5x_D.png | 5 months ago | |
| 1a_4_5x_D.png | 5 months ago | |
| Readme.md | 5 months ago | |
| analysis.ipynb | 5 months ago | |
| example.csv | 5 months ago | |
| measurements-example.jpg | 5 months ago | |
Readme.md
General procedure
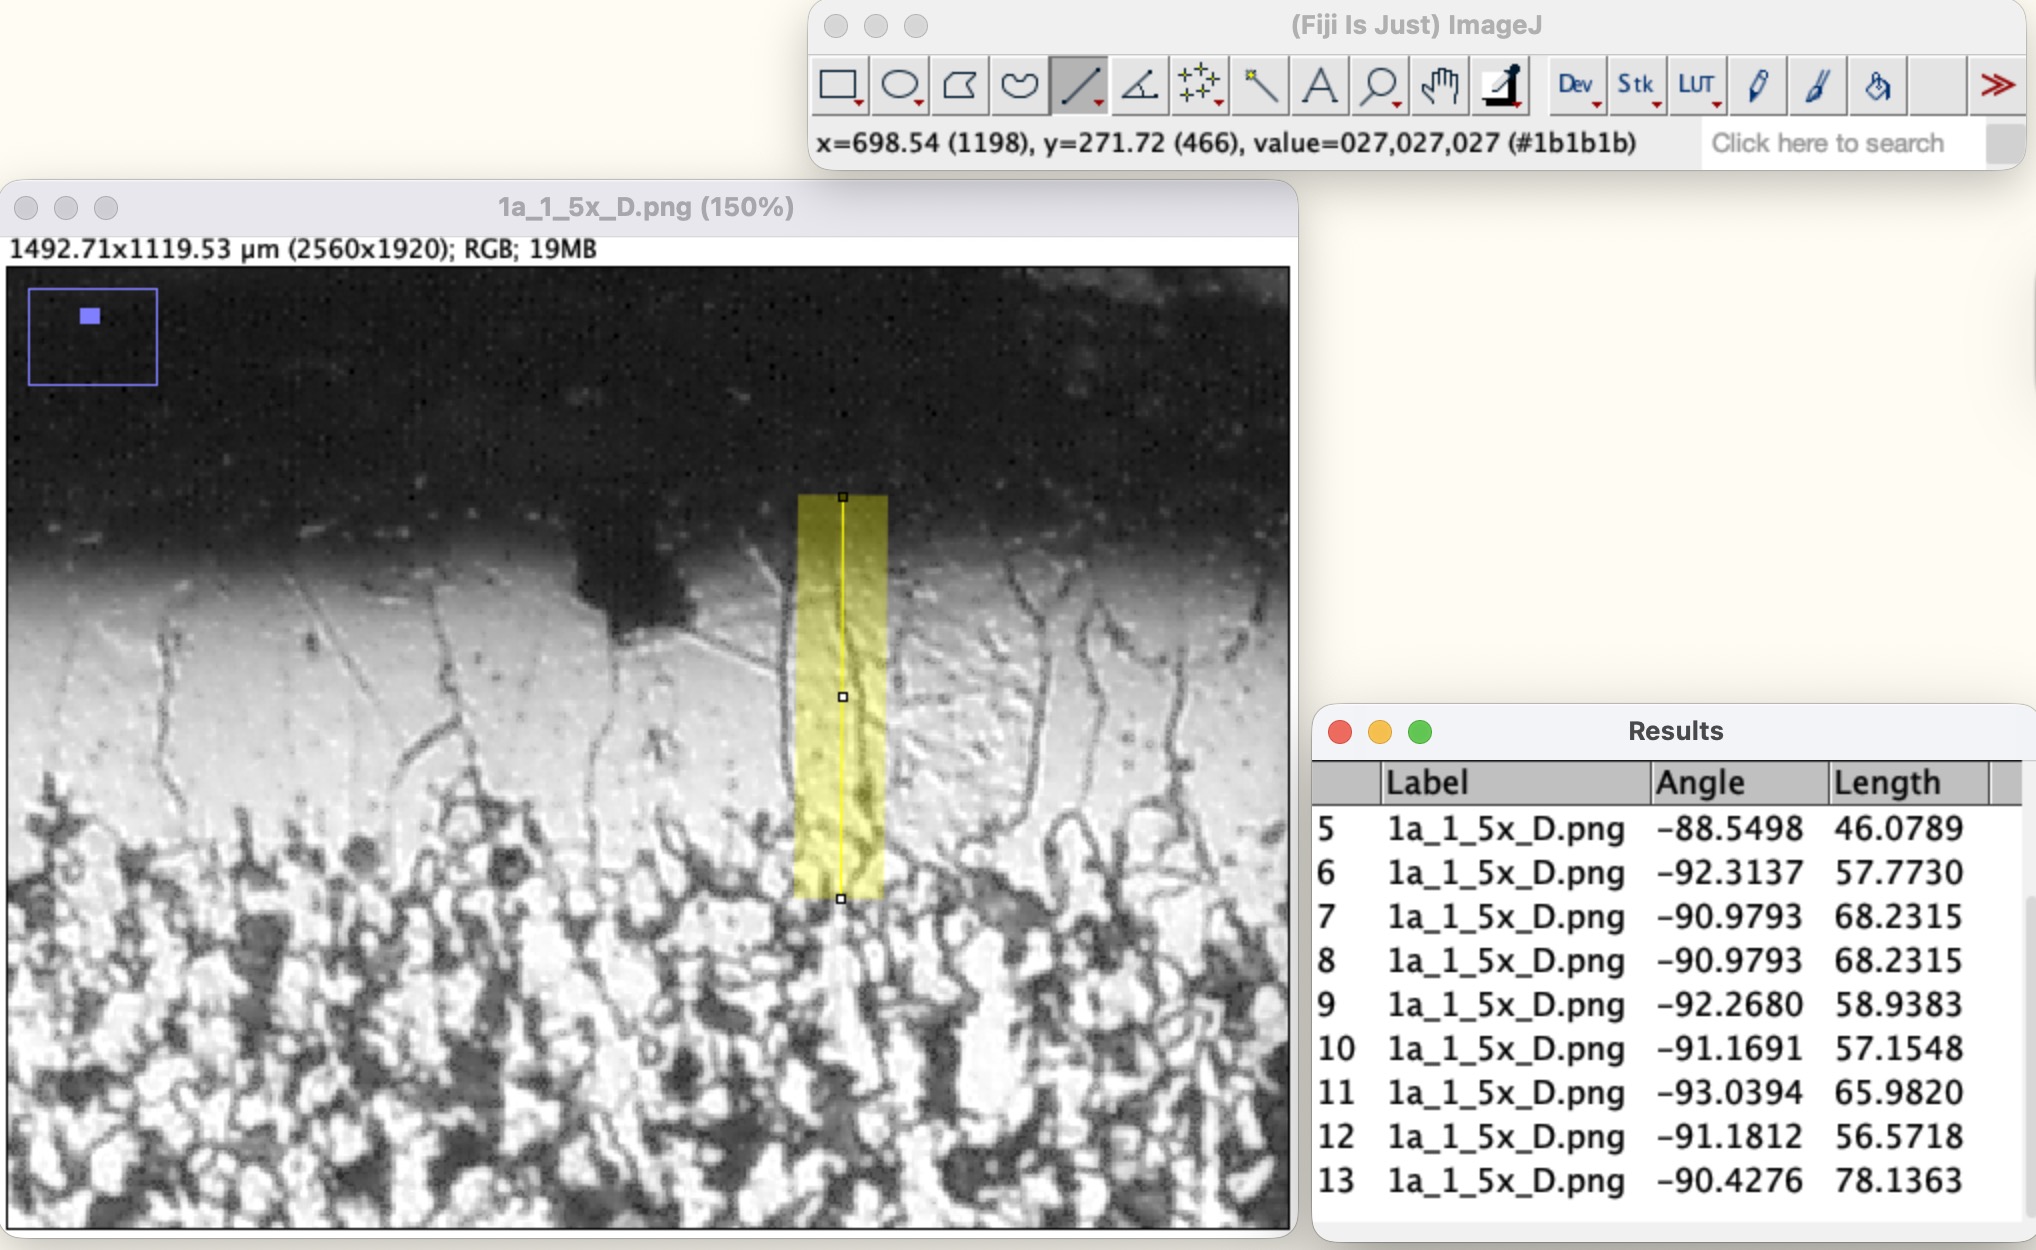
Set Scale100um -> 171 pxSet Measurements...bounding rectangle, display label, Decimals 4, Redirect noneMeasureandClear Measurementsto produce a new and clear measuremens table- Use the
Straighttool to draw a line thta fits into the decarburated area - Press
^+mto add the measurement into the table - Repeat the process at least 50 times
Tasks
- From microscope images get at least 50 measurements from each;
- Export the
csvfile for each collection of measurements - Compute the basic descriptive statistics for each image:
- sample size
- mean
- median
- standard deviation
- minimum
- maximum
- range
- Compute the basic descriptive statistics for the complete dataset (200 measurements)
- Prepare the following graphs:
- One histogram for each image
- Compare all histograms
- One boxplot comparing the four zones (images)
- Extract the following information:
- central tendency,
- spread,
- possible outliers,
- difference among images (zones)
- State random variables
- Define a random variable for the legth property
- Define a discrete random variable, whose measurement is grater than a threshold (50um)
- Define an indicator random variable that states:
I_{ij} = 1, if the measurement exceeds the thresholdI_{ij} = 0, otherwise
- Compare images, based on your statistics and plots, answer the following:
- Which image has the largest mean?
- Which image has the greatest variability?
- Do all images appear similar?
- Does one image seem to come from a different population?
- Your
Readme.mdfile must include:- Introduction
- Random variables background
- Objective
- Description of the data
- Table of the descriptive statistics
- Required plots and its description
- Definition of random variables
- Comparison of images
- Conclusions
- Attach the 4
csvfiles
- Your report must answer the following
- What is the measured variable in your experiment?
- Why can this variable be modeled as a random variable?
- Which of your proposed variables are continuous?
- Which of your proposed variables are discrete?
- Which image has the highest mean value?
- Which image has the largest dispersion?
- What does your threshold analysis indicate?
- What can you conclude about the variability of the measurements.