|
|
11 months ago | |
|---|---|---|
| Readme.md | 11 months ago | |
| bloxplot.jpg | 11 months ago | |
| main.R | 11 months ago | |
| penguin-plot.png | 11 months ago | |
Readme.md
Introduction
Data science is a discipline that allows you to transform raw data into understanding, insight, and knowledge.
The goal of Data Science is to help you learn the most important tools in R that will allow you to do data science efficiently and reproducibly.
In our model of the data science process, you start with data import and tidying. Next, you understand your data with an iterative cycle of transforming, visualizing, and modeling. You finish the process by communicating your results to other humans.
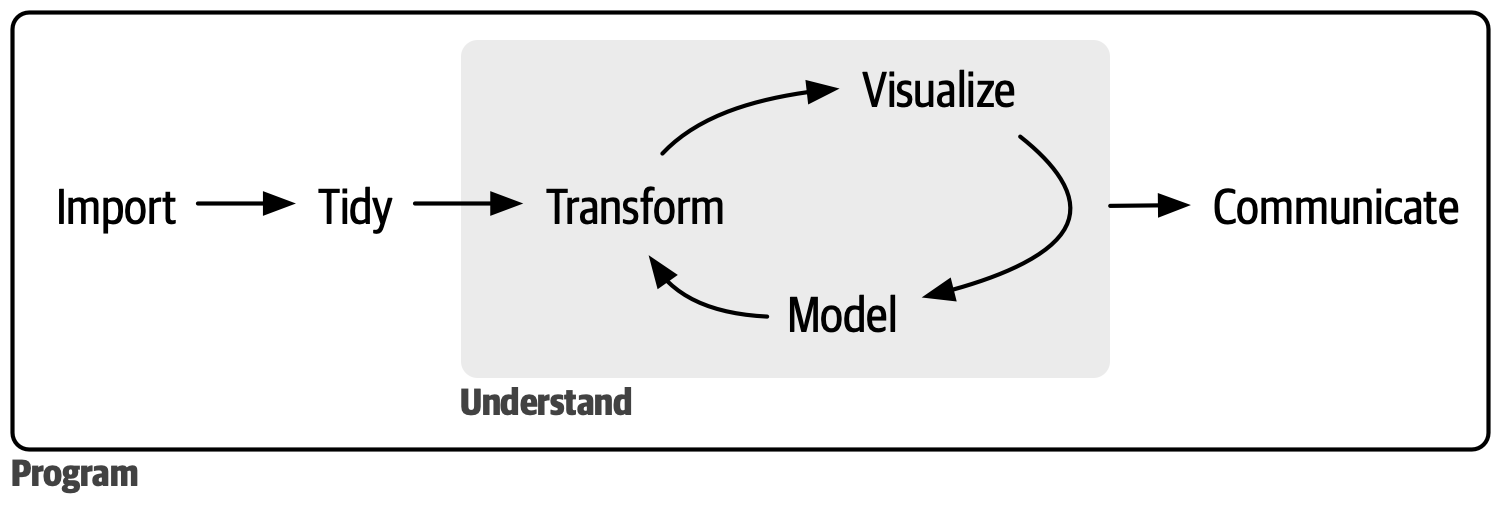
The data science process
First, you must import your data into R. This means that you take data -file, database, or web application programming interface (API)- and load it into a data frame in R.
Once data has been imported, it is a good idea to tidy it. Tidying data means storing it in a consistent form that matches the semantics of the dataset with how it is stored; each column is a variable and each row is an observation instance. Tidy data is important because the consistent structure lets you focus your efforts on answering questions about the data.
Once you have tidy data, a common next step is to transform it. Transformation includes narrowing in on observations of interest (like all people in one city or all data from the last year), creating new variables that are functions of existing variables (like computing speed from distance and time), and calculating a set of summary statistics (like counts or means). Together, tidying and transforming are called wrangling.
Once you have tidy data with the variables you need, there are two main engines of knowledge generation: visualization and modeling. These have complementary strengths and weaknesses, so any real data analysis will iterate between them many times.
Visualization is a fundamentally human activity. A good visualization will show you things you did not expect or raise new questions about the data. A good visualization might also hint that you’re asking the wrong question or that you need to collect different data. Visualizations may provide unexpected insights; however, they do not scale effectively as they necessitate human interpretation.
Models are complementary tools to visualization. Once you have made your questions sufficiently precise, you can use a model to answer them. Models are fundamentally mathematical or computational tools, so they generally scale well. But every model makes assumptions, and by its very nature, a model cannot question its own assumptions. That means a model cannot fundamentally surprise you.
The last step of data science is communication, an absolutely critical part of any data analysis project. It doesn’t matter how well your models and visualization have led you to understand the data unless you can also communicate your results to others.
Surrounding all these tools is programming. Programming is a cross-cutting tool that you use in nearly every part of a data science project. You don’t need to be an expert programmer to be a successful data scientist, but learning more about programming pays off because becoming a better programmer allows you to automate common tasks and solve new problems with greater ease.
You’ll use these tools in every data science project, but they’re not enough for most projects. There’s a rough 80/20 rule at play: you can tackle about 80% of every project using the tools you’ll learn in this book, but you’ll need other tools to tackle the remaining 20%. Throughout this book, we’ll point you to resources where you can learn more.