You cannot select more than 25 topics
Topics must start with a letter or number, can include dashes ('-') and can be up to 35 characters long.
3.5 KiB
3.5 KiB
OLS Ordinary Least Squares
The OLS general model \hat{y} is defined by:
\hat{y} = \theta_0+\theta_1 x_1 Applying the partial derivatives with rescpect \theta_0 and equaliting to zero:
\frac{\partial SSR}{\partial \theta_0}=0 here SSR is defined as:
\sum_{i=1}^n (y^i - \hat{y}^i)^2 Resulting in:
\theta_0 = \frac{\sum_{i=1}^n y^i}{n} - \frac{\theta_1 \sum_{i=1}^n x^i}{n}or
\theta_0 = \bar{y} -\theta_1 \bar{x} In a similar way, the partial derivative of SSR with respect of \theta_1 will result in:
\theta_1 = \frac{\sum_{i=1}^n x^i(y^i-\bar{y}) }{\sum_{i=1}^n x^i(x^i-\bar{x})}Implementing OLS in Python
import numpy as np
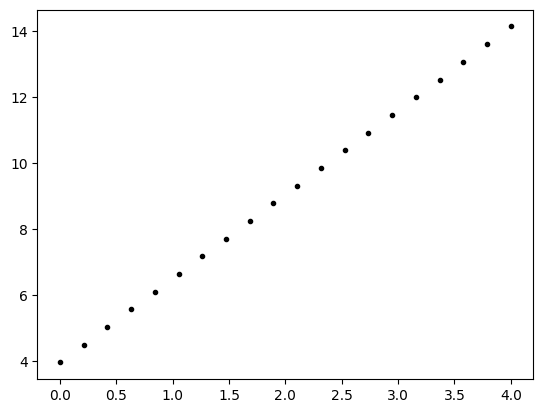
x = np.linspace(0,4,20)
theta0 = 3.9654
theta1 = 2.5456
y = theta0+theta1*x
y
array([ 3.9654    ,  4.50131579,  5.03723158,  5.57314737,  6.10906316,
        6.64497895,  7.18089474,  7.71681053,  8.25272632,  8.78864211,
        9.32455789,  9.86047368, 10.39638947, 10.93230526, 11.46822105,
       12.00413684, 12.54005263, 13.07596842, 13.61188421, 14.1478    ])
import matplotlib.pyplot as plt
plt.plot(x,y, '.k')
plt.show()
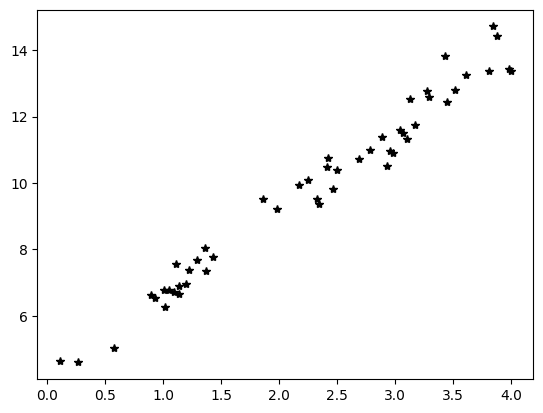
x = 4*np.random.rand(50, 1)
y = theta0 + theta1*x+0.5*np.random.randn(50, 1)
plt.plot(x,y, '*k')
plt.show()
Implementing with for
\theta_1 = \frac{\sum_{i=1}^n x^i(y^i-\bar{y}) }{\sum_{i=1}^n x^i(x^i-\bar{x})}# for implementation for computing theta1:
xAve = x.mean()
yAve = y.mean()
num = 0
den = 0
for i in range(len(x)):
num = num + x[i]*(y[i]-yAve)
den = den + x[i]*(x[i]-xAve)
theta1Hat = num/den
print(theta1Hat)
[2.4717291]
# for implementation for theta0:
# $$ \theta_0 = \bar{y} -\theta_1 \bar{x} $$
theta0Hat = yAve - theta1Hat*xAve
print(theta0Hat)
#real values are
#theta0 = 3.9654
#theta1 = 2.5456
[4.18459936]
total = 0
for i in range(len(x)):
    total = total + x[i]
total/len(x)
array([2.27654582])
Implementing OLS by numpy methods
# For theta1:
# $$\theta_1 = \frac{\sum_{i=1}^n x^i(y^i-\bar{y}) }{\sum_{i=1}^n x^i(x^i-\bar{x})}$$
num2 = np.sum(x*(y-y.mean()))
den2 = np.sum(x*(x-x.mean()))
theta1Hat2 = num2/den2
print(theta1Hat2)

# Efficacy --> time
2.4717291029649546
theta0Hat2 = yAve-theta1Hat2*xAve
theta0Hat2
4.184599360470533
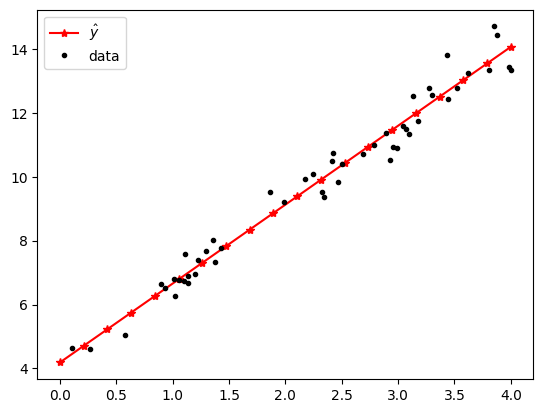
Comparing Model and Data
xNew = np.linspace(0,4,20)
yHat = theta0Hat + theta1Hat*xNew
plt.plot(xNew, yHat, '-*r', label="$\hat{y}$")
plt.plot(x,y,'.k', label="data")
plt.legend()
plt.show()
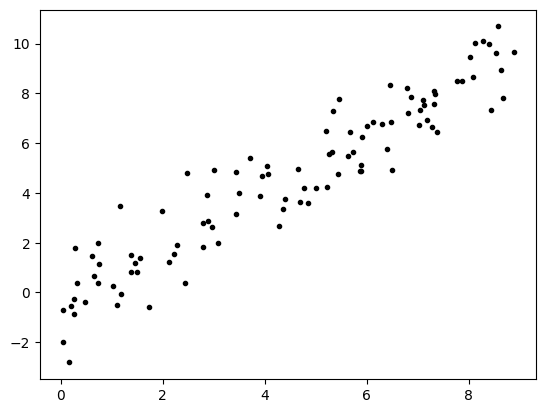
Functions for data and OLS
def DataGen(xn: float,n: int, disp,theta0=3.9654,theta1=2.5456):
    x = xn*np.random.rand(n, 1)
    #theta0 = 3.9654
    #theta1 = 2.5456
    y = theta0+theta1*x+disp*np.random.randn(n,1)
    return x,y
x,y = DataGen(9, 100, 1, 0,1)
plt.plot(x,y,'.k')
plt.show()
def MyOLS(x,y):
    # for implementation for computing theta1:
    xAve = x.mean()
    yAve = y.mean()
    num = 0
    den = 0
    for i in range(len(x)):
        num = num + x[i]*(y[i]-yAve)
        den = den + x[i]*(x[i]-xAve)
    theta1Hat = num/den
    theta0Hat = yAve - theta1Hat*xAve
    return theta0Hat, theta1Hat
the0, the1 = MyOLS(x,y)
the1
array([1.12539439])
TODO - Students
- Efficacy --> time: For method Vs. Numpy