You cannot select more than 25 topics
Topics must start with a letter or number, can include dashes ('-') and can be up to 35 characters long.
|
|
11 months ago | |
|---|---|---|
| main_files | 11 months ago | |
| Readme.md | 11 months ago | |
| main.ipynb | 11 months ago | |
Readme.md
Excersices
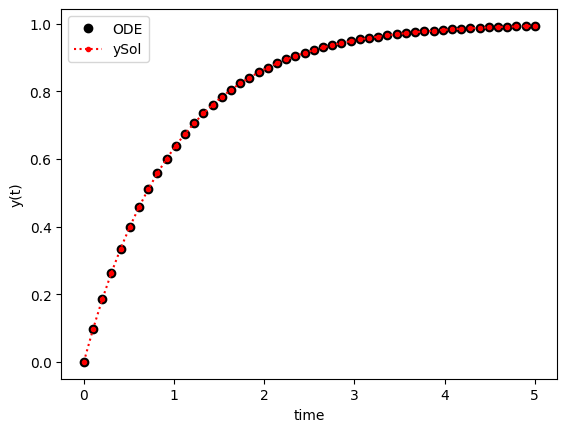
Find a numerical solution to the following differential equations with the associated initial conditions. Expand the requested time horizon until the solution reaches a steady state. Show a plot of the states (x(t) and/or y(t)). Report the final value of each state as t \rightarrow \infty.
Problem 1:
\frac{dy(t)}{dt} = -y(t)+1 with,
y(0)=0This equation can be solved using the separation of variables method:
y(t) = 1-e^{-t}import numpy as np
from scipy.integrate import odeint
import matplotlib.pyplot as plt
# function that returns dy/dt
def model(y,t):
dydt = -y + 1.0
return dydt
# initial condition
y0 = 0
# time points
t = np.linspace(0,5)
# solve ODE
y = odeint(model,y0,t)
ySol = 1-np.exp(-t)
# plot results
plt.plot(t,y,'ok', label='ODE')
plt.plot(t,ySol, '.:r', label='ySol')
plt.legend()
plt.xlabel('time')
plt.ylabel('y(t)')
plt.show()
Problem 2
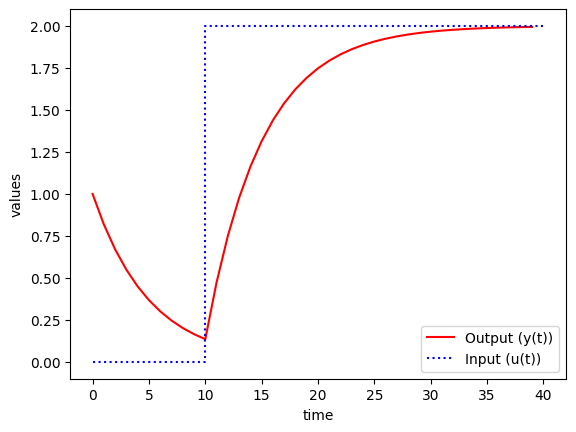
5\frac{dy}{dt}=-y(t)+u(t)with,
y(0)=1and u step at t=2
# function that returns dy/dt
def model(y,t):
    # u steps from 0 to 2 at t=10
    if t<10.0:
        u = 0
    else:
        u = 2
    dydt = (-y + u)/5.0
    return dydt

# initial condition
y0 = 1

# time points
n = 40
t = np.linspace(0,n-1,n)
# solve ODE
y = odeint(model,y0,t)

# plot results
plt.plot(t,y,'r-',label='Output (y(t))')
plt.plot([0,10,10,40],[0,0,2,2],'b:',label='Input (u(t))')
plt.ylabel('values')
plt.xlabel('time')
plt.legend(loc='best')
plt.show()
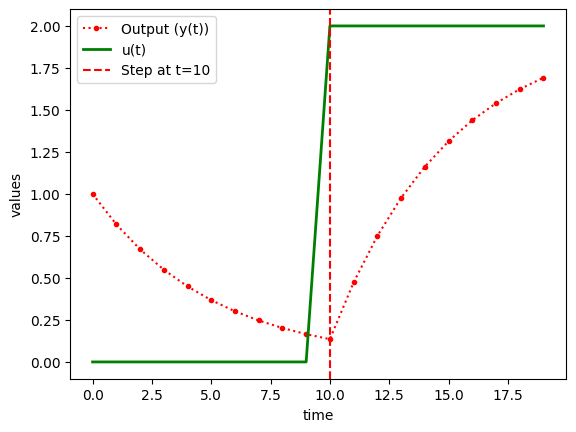
# Define the step function u(t)
def u(t):
    return 0 if t < 10.0 else 2  # Step from 0 to 2 at t = 10

# function that returns dy/dt
def model(y,t):
    dydt = (-y + u(t))/5.0
    return dydt

# initial condition
y0 = 1

# time points
n = 20
t = np.linspace(0,n-1,n)

# solve ODE
y = odeint(model,y0,t)
# Compute u(t) for all values in t
u_values = np.array([u(ti) for ti in t])  # Evaluate u at each time point


# plot results
plt.plot(t,y,'.:r',label='Output (y(t))')
plt.plot(t, u_values, 'g-', linewidth=2, label="u(t)")
plt.axvline(x=10, color='r', linestyle='--', label="Step at t=10")
plt.ylabel('values')
plt.xlabel('time')
plt.legend(loc='best')
plt.show()


